
D4: Data Driven Decisions
|
iCan use digital tools like spreadsheets and infographics to gather and report data on a given topic to help make informed decisions.
|
|
D4 Lingos
Spreadsheet
At its basic level, a spreadsheet is a set of columns and rows of cells that are organized and formatted to show information in a meaningful way.
At its basic level, a spreadsheet is a set of columns and rows of cells that are organized and formatted to show information in a meaningful way.
Cell
The basic unit of a spreadsheet. Cells are boxes that can be adjusted to any size and hold various kinds of information and be formatted in different ways
The basic unit of a spreadsheet. Cells are boxes that can be adjusted to any size and hold various kinds of information and be formatted in different ways
Column
The vertical or up and down organization of cells. Columns are identified by a letter.
The vertical or up and down organization of cells. Columns are identified by a letter.
Rows
The horizontal or across the page organization of cells. Rows are identified with a number.
The horizontal or across the page organization of cells. Rows are identified with a number.
Cell Borders
The outside lines that are the sides of a cell. A spreadsheet program has different settings to control the appearance of cell borders, including line styles, colors, and sometimes thicknesses.
The outside lines that are the sides of a cell. A spreadsheet program has different settings to control the appearance of cell borders, including line styles, colors, and sometimes thicknesses.
Headings
Cells at the beginning of a row or column of data on a table that labels the data.
Cells at the beginning of a row or column of data on a table that labels the data.
Google Sheets
Google spreadsheet app.
Google spreadsheet app.
Cell Formatting
All the different formatting adjustments you can to do to the background and text in a cell.
All the different formatting adjustments you can to do to the background and text in a cell.
Formulas
Math equations that can be plugged into a set of information on a spreadsheet. These equations include being able to add or subtract data, find averages of data, etc.
Math equations that can be plugged into a set of information on a spreadsheet. These equations include being able to add or subtract data, find averages of data, etc.
D4 Tutorial Tools & Resouces
D4 Focus Skills & Questions
- How can a spreadsheet organize a set of information?
- The basic unit of a spreadsheet is the _____________.
- What do we use to make data calculations on a spreadsheet?
- Cells are organized up and down in ________ and side to side in _________ on a spreadsheet.
- What kind of data graphs can me made in Google Sheets?
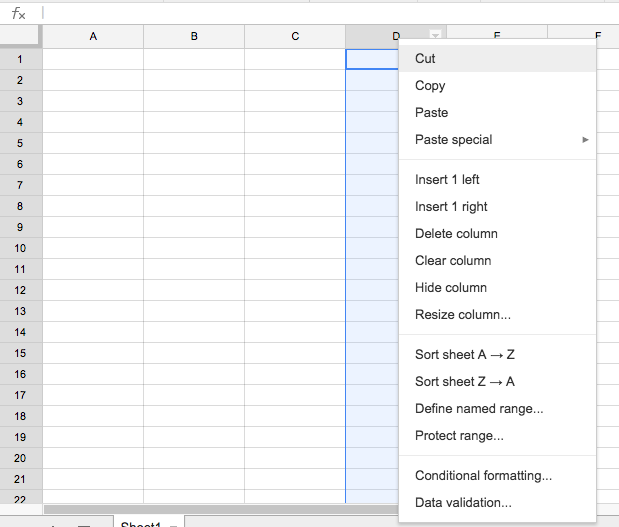
Details: Create these visuals on the D4 iCan slide. use the screenshots below of different tools in Google Sheets. Label the screenshots below with the list of features next to each.
|
Google Sheets Main Page
Google Sheets Cell Formating Controls

|
Google Sheets Main Page Labeling
Google Sheets Cell Formating Controls
|
Level 3
Part 1 - Lets get used to using Google Sheets a bit. Follow the tutorial below on creating your own Google Sheets Art!
D4 Level 3 Rubric/Grading checklist
- Spreadsheet is formatted with 30 columns and 30 rows.
- Cells are square not rectangular, and should be a measurement of 20x20 pixels.
D4 Performance Task
Simulation Overview: In this simulation, you are a data scientist for the M&M company. The head honchos are worried that their bags of M&Ms are not consistently representing all the colors of their awesome candies in each bag. The cup of M&Ms that you were given in class represents a bag of M&Ms. Take a moment to count each color and record the information someplace for safe keeping.
Lets take a look at graphing some information that we have collected with colors of M&Ms. Below are three different steps to creating a spreadsheet with this data. The first step is organizing your data. Step two will show you how to use formulas to summarize your data. Step three will show you how to create an effective graph from the data.
Lets take a look at graphing some information that we have collected with colors of M&Ms. Below are three different steps to creating a spreadsheet with this data. The first step is organizing your data. Step two will show you how to use formulas to summarize your data. Step three will show you how to create an effective graph from the data.
|
Step 1: Organize the Data The first step is organizing your M&M data into a spreadsheet table. We will use the colors for the column headings and some titling for the row headings. We will also need to adjust the column widths a bit to make room for the row headings. Finally, we will enter in the M&M Color data we collected in class. Watch the tutorial carefully, and follow the instruction it gives.
|
Step 1 M&M Data Spreadsheet Setup
CLICK HERE to view this video in Google Drive.
|
|
Step 2: Using Formulas Step two will show you how to use formulas to summarize your data. Again, watch the tutorial carefully and recreate what is demonstrated with your data.
|
Step 2 - GS M&M Data Formulas/Functions
CLICK HERE to view this video in Google Drive.
|
|
Step 3: Creating A Graph Step 3 will show you how to create an effective graph from the M&M data. Again, watch the tutorial carefully and recreate what is demonstrated with your data.
|
Step 3 - GS M&M Data Creating a Graph
CLICK HERE to view this video in Google Drive.
|
|
Step 4: Table Formatting In this final step, lets take a look at some ways you can customize your table of information. Again, watch the tutorial carefully and recreate what is demonstrated with your spreadsheet.
|
Step 4 - GS M&M Data Format Spreadsheet
CLICK HERE to view this video in Google Drive.
|
Rubric/Grading checklist
- 4pts - Correctly designed table with with Colors listed and data recorded
- 4pts - Properly formatted Pie Graph with graph and key
- 4pts - Titles for table and graph each, accurately naming what they are.
- 4pts - Correct use of formulas to calculate total and average
- 4pts - Use of color to match data in graph and table, set apart cells, make text appear effectively, and set borders in table.
- 20 Points Total
D4 Check for Understanding Assessment
Please take the D4 Quiz in Google Classroom. Remember, you need to score a 70% or better to show proficiency for this Learning Target.
Extra D4 Stuff
Spreadsheet Activity 2: Ralph's Business s2_YLNACralphbusTask 1Read the paragraph below about Ralph's Lawn Care business. Take the data from the paragraph and organize it into a table on a Numbers file you create. See if you can figure out how to do it from your experience with Activity 1 and/or by watching the Apple tutorials. I will share an example with you later on of what your table might look like. Think about the headings for the columns that you will need to use.
Ralph has a summer business mowing lawns to make extra money. Ralph has hired you as a business consultant to help him analyze the various parts of his business. He wants to organize his customer information that is listed below. The information below lists the customer's name, the fee for cutting their lawn each week, and the day of the week that Ralph cuts their lawn. Help out Ralph and organize the data below into a table using Numbers:
Jones - $15 – Monday, Smith - $10 – Friday, Franks - $12 – Tuesday, Dell - $17 – Friday, Roberts - $8 – Friday, Franklin - $15 – Tuesday, Patrick - $15 – Thursday, Sinke - $17 – Friday, Johnson - $10 – Thursday, Blik - $10 - Thursday
Take some time to format your table of information to make it look readable and more attractive. Try using some border controls, font changes, cell coloring, etc. to jazz up your table a bit. Use color, font styling, and bordering to organize your data. Remember, design with a purpose.Task 2Now that we have created a table of data, lets see if we can take the data and make it into some graphs.
Ralph would like to know who is best paying customers are and the percentage of the business they make up. Make a pie graph of the different customers and their fees to compare which customer generates more money for Ralph's business. Be sure to watch the tutorials from the M&M Data project or Introduction to using Numbers tutorial again to see how to do this if you forgot.
CHALLENGE! Ralph wants to expand his business and take on more lawn care clients. He decides that he can handle up to 5 customers per day. Ralph needs a bar graph comparing the amount of lawn mowing jobs on certain days of the week. Try and see if you can do this, it is challenging! Think about different ways of doing this.
Arrange your spreadsheet so all parts fit on a page and there is a title at the top describing the purpose of this spreadsheet. Be creative! Don't forget to title your pie graph and bar graph as well.
Task 3After looking over the data that you prepared for his business regarding how many customers he has on days of the week, Ralph decides to go out and look for more customers. One of his business goals is to have no more than 5 customers a day. Below is a list of new customers he has solicited. Add these customers to your customer data table. BE SURE TO INSERT NEW ROWS IN WITH THE ONES YOU ALREADY HAVE. Mr. H will demonstrate:
Phillips, Wednesday, $20
Spencer, Friday, $15
Hayes, Tuesday, $12
Tillman, Saturday, $25
Parker, Saturday, $30
Monroe, Friday, $10
Roush, Monday, $10
Check to make sure your pie graph has adjusted to the new data. More importantly, make sure your table comparing the number of customers on days of the week and the bar graph analyzing that data is updated. Is there a problem with his new costumers based on his business goals?Task 4Ralph has decided that he wants to expand his business into the winter. Although he has school, he thinks that he would have enough time to be able to remove snow from customers walkways and driveways to earn extra money. He decides to offer this service to his existing customers first to see if there is any interest. The list below shows the customers that order the service and the fee for snow removal each time:
Jones - $20, Dell - $15, Franks - $10, Sinke - $25, Johnson - $15, Blik - $20
- Add this information to your existing table for Ralph's Business
- Adjust your column headings to make sense of this new information
- Sort your table by the customer's last name. Mr. H will show you.
- Create a title for your spreadsheet, and include your name as the creator.
